So as some of you already know, I've been running a simulation of what the outcome of the UK election just gone by would have been if, instead of using the First Past the Post system, it had been calculated using the d'Hondt List system.
I have done this on a regional rather than a national basis, mostly because this is how the British do it for the European election and I see no reason to change that. Other options were to do it nationally or county by county, but I considered both to be too time consuming, and I wanted to get this done while it was still highly relevant, rather than a week or so down the line, as well as the fact that I am in the middle of exams.
Regional vote % here: http://news.bbc.co.uk/2/shared/election2010/results Click on regions to see the vote breakdown.
Current seats (a more accurate map than the BBC's): http://img52.imageshack.us/img52/2015/mapse.png
The regions are as follows: Northern Ireland, Wales, Scotland, North-East, Yorkshire & the Humber, North-West, East Midlands, Eastern, West Midlands, South-East, South-West and London.
Northern Ireland
Actual Seats: DUP 8, SF 5, SDLP 3, AP 1, Ind Un 1
d'Hondt: DUP 5, SF 5, SDLP 3, UCU 3, AP 1, Ind Un 1
Under d'Hondt, Northern Ireland's overall Unionist/Nationalist balance remains more or less unchanged. What it does do is redress in favour of the UCU, who failed to win any seats despite getting over 15% of the vote, more than double that of the Alliance Party. This more accurately reflects the SF/DUP balance - indeed, SF were marginally ahead in the popular vote. The two Independent Unionist candidates who did well, Hermon and Connor, would have had enough between them to gain one of them a seat, an list alliance that would to me make sense, the alternative being another SF seat.
Wales
Actual Seats: Lab 26, Con 8, LD 3, PC 3
d'Hondt: Lab 16, Con 11, Lib 8, PC 4, UKIP 1
In FPTP, Labour, in spite of losses, still won an overwhelming majority of Welsh seats with just over a third of the popular vote - a microcosm of the situation that frequently emerges in Westminster. The d'Hondt system rebalances this extensively, as it does for the significant under-representation of Tories and, to a greater extent, Lib Dems. Interestingly, the support for UKIP in the south is enough to scrape them a seat at the expense of a 5th one for Plaid. The outcome here is pretty much as close to proportional to the popular vote as possible.
Scotland
Actual Seats: Lab 41, LD 11, SNP 6, Con 1
d'Hondt: Lab 26, SNP 12, LD 11, Con 10
Like Wales, the biggest party - Labour - benefits disproportionately under FPTP. The SNP, who have the second biggest vote-share but suffer under the system double their number of seats, and there's a massive gain for the Tories, whose votes are not insignificant. The result under d'Hondt gives a better feel for the actual strength of support for the SNP within Scotland.
North-East
Actual Seats: Lab 25, Con 2, LD 2
d'Hondt: Lab 14, Con 7, LD 7, BNP 1
Labour dominate most urban constituencies, but their popular vote is around the combined Tory/Lib Dem total, rather than over six times greater than it - something that is again reflected by the d'Hondt figures. The BNP would also win a seat fairly comfortably in this region, and UKIP would only miss out on one by an extremely narrow margin.
Yorkshire & the Humber
Actual Seats: Lab 32, Con 18, LD 2
d'Hondt: Lab 19, Con 18, LD 13, BNP 2, UKIP 1
Labour hold a majority of seats here despite only being marginally ahead of the Tories in the popular vote. d'Hondt shows the source of that - Lib Dems being closed out in a lot of Labour seats, the Tory vote actually being reflected in the FPTP figures. This area is the heartland of the BNP and as such it is unsurprising to see them (and UKIP) claim a couple of seats.
North-West
Actual Seats: Lab 47, Con 22, LD 6
d'Hondt: Lab 31, Con 24, LD 17, UKIP 2, BNP 1
Not much different here to the previous two constituencies - a grossly inflated Labour majority due to FPTP, largely at the expense of the Lib Dems and the nationalist parties.
East Midlands
Actual Seats: Con 31, Lab 15
d'Hondt: Con 20, Lab 14, LD 10, UKIP 1, BNP 1
Bit of an FPTP travesty here - in spite of getting over 20% of the popular vote, an increase from last time, the Lib Dems failed to win a single seat in this region - indeed, they actually lost one. That is handily redressed by the d'Hondt system, as is the Tory false majority in the region. The BNP recieved a massive swing in this area, sextupling their vote since last time and as such would win a seat.
Eastern
Actual Seats: Con 52, LD 4, Lab 2
d'Hondt: Con 29, LD 14, Lab 12, UKIP 2, BNP 1
This area is hardcore Tory and Labour were as good as wiped out here with FPTP, though if it had been d'Hondt they would only have lost one of their seats from last time's FPTP results. This area also swung heavily towards the nationalist parties, which again would have been reflected through the d'Hondt system.
West Midlands
Actual Seats: Con 33, Lab 24, LD 2
d'Hondt: Con 25, Lab 19, LD 12, UKIP 2, BNP 1
The two big parties are both fairly over-represented in this area, which is fixed. Not much else interesting here to remark on other than that even if he had formed a list with every other independent candidate in the area, the Health Concern bloke from Wirral still would have lost his seat.
South-East
Actual Seats: Con 75, LD 4, Lab 4, Green 1
d'Hondt: Con 44, LD 23, Lab 13, UKIP 3, Green 1
Conservatives absolutely dominated this area under FPTP and still have a majority of seats under d'Hondt, though their gross over-representation would be eroded, mostly in favour of the Lib Dems. The Greens would comfortably still win a seat in the region, and UKIP would get three, the relatively high number due to the high-profile presence of Farage.
South-West
Actual Seats: Con 36, LD 15, Lab 4
d'Hondt: Con 24, LD 20, Lab 9, UKIP 2
d'Hondt far more accurately reflects the relative closeness of the Lib Dem and Tory votes in this region than FPTP does. Other than that it's the same story as it was in the north of England, just with all the parties swapping positions.
London
Actual Seats: Lab 38, Con 28, LD 7
d'Hondt: Lab 28, Con 26, Lib 16, UKIP 1, Green 1, BNP 1
Labour and Tories are actually very close in terms of vote share in the capital, hence the tightening of the gap between the two under d'Hondt. The three smaller parties gain a seat each due to having plenty of candidates doing relatively well - all three got over 1.5% of the total vote - but no one candidate doing well enough to win in a single region.
OVERALL
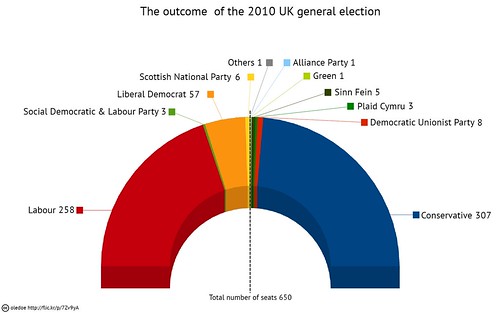
Actual Seats: Con 306, Lab 258, LD 57, DUP 8, SNP 6, SF 5, PC 3, SDLP 3, Green 1, AP 1, Ind Un 1
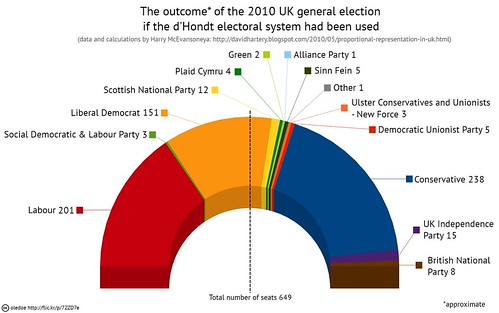
d'Hondt: Con 238, Lab 201, LD 151, UKIP 15, SNP 12, BNP 8, SF 5, DUP 5, PC 4, SDLP 3, UCU 3, Green 2, AP 1, Ind Un 1
The d'Hondt outcome is actually extremely close to being proportional to the popular vote, though the smaller parties still lose out a bit - however they do gain massively compared to FPTP - and the NI parties continue to benefit disproportionately. It is worth noting that these are FPTP figures - if a d'Hondt sytem were to be used, smaller parties would probably benefit accordingly, as there would be less pressure on finding and fielding candidates in all constituencies, and there would be less of an element of tactical voting to keep party X out of constituency Y.
Regardless, on the basis of this simulation I feel the UK could probably do a lot worse than go with d'Hondt.
All original material (c) 2010 Harry McEvansoneya - Any material relied upon is copyright of their respective owners.
EDIT: Was linked to the following on twitter - Graphical interpretation of a few forms of PR and the results under all of them. (cc) oledoe flic.kr/p/7ZrYpv
"Pure" proportional representation:

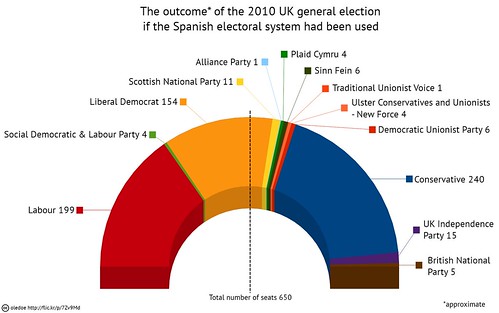
Spanish system:
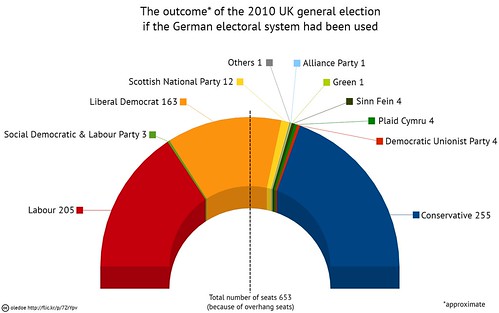
German system:

1 comments:
The UK Election has been an exciting activity for the people of UK. The Children's books about nature are good books to read while the kids are on holidays for the election. Thanks for the post!
Post a Comment